Navigate economic data projects with confidence.

InfografiaMX helps organizations source, integrate, and analyze economic data, from research to finished pipelines and datasets.

Mexico GDP — Q4 2022, Annual Variation (%)
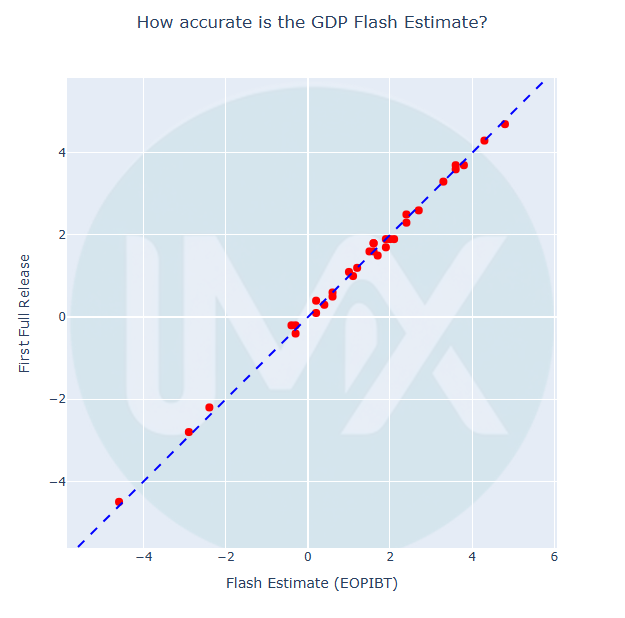
Flash estimate · Jan 2023 · base 2013 3.5
First official release · Feb 2023 · base 2013 3.6
Current value · Aug 2026 · base 2018 4.6
The gap between the second and third rows isn't a data revision — it spans a change in the national accounts' base year. Distinguishing the two is what point-in-time tracking is for.

Our services

Some of our services include:

Data sourcing & pipeline management

We source and deliver data aligned with your requirements, prioritizing completeness, timeliness, accuracy, and recency. We work closely with your data and engineering teams to integrate and operationalize data within your existing databases and infrastructure. Alternatively, we can manage your datasets end-to-end through our cloud-based PostgreSQL databases and data pipelines, providing a scalable and reliable foundation for your data workflows.

Data validation & transparency

Data transparency is foundational to reliable data operations. We document and validate your data against authoritative primary sources, identify the most relevant indicators for your use cases, and ensure your datasets remain transparent, traceable, and up to date. Through rigorous data research, we support the collection and documentation of both data and metadata, providing the provenance and context needed to understand, validate, and effectively use your datasets.

Proprietary Datasets

We continuously onboard datasets that enable research and testing. Datasets are updated according to the schedules defined by their primary sources and undergo rigorous quality controls to ensure data integrity and reliability
New

Mexico's National Accounts Point-in-time

This structured, point-in-time database is designed specifically for quantitative researchers, traders, and institutional asset managers. It captures the historical release cycle and subsequent revision vintages of Mexico's Gross Domestic Product (GDP) and the Global Indicator of Economic Activity (IGAE).

For sample data and documentation, please submit your request via the contact form below.

View full dataset details →

Scatter plot comparing Mexico's GDP flash estimate (EOPIBT) against the first official release for every quarter since Q3 2015, with points closely tracking the 45-degree line

Let's discuss your project.

Tell us what you're working on. We'll review your requirements and recommend the best approach, with no obligation.

soporte@infografiamx.net